
Since starting this blog a few years ago, I’ve written at length about marketing analytics, Google Analytics, key performance indicators (KPIs), data silos and everything else it takes to make sure that you’re capturing the right customer data to improve your customer experience and increase your ROI – it brings money in the door.
Quite frankly, I’ve said many times that you have to conduct analytics to make the data you capture useful. If you’re not paying attention to who your customer is, what they’re buying and how that’s changing over time, you’re not keeping up with the world around us.
The easiest way to combine all these priorities, keep your team on track and stay on top of what matters most is through dashboards. These highly visual representations put your KPIs front-and-center for quick and easy review.
Dashboards allow your entire organization to be updated and more agile in marketing decisions. At the core levels:
- The marketing team stays more engaged, not overwhelmed. I’ve said before that your marketing team cannot be the wild west, and dashboards are a clear way to ensure your team is working toward the same goals, measured against the same metrics, at the same time.
- The C-suite has the right information, up to the minute, to make decisions. Dashboards communicate marketing results in ways that even non-marketers can understand, so the highest levels of your company will know what is working and where to direct your efforts and resources.
Dashboards can be as simple as the three to four KPIs that are the metrics you need to make decisions on your marketing strategy or data on which you make daily decisions to change your PPC strategy. I have one client that looks at three charts hourly to ensure their online ads are getting the right results – and they make changes immediately.
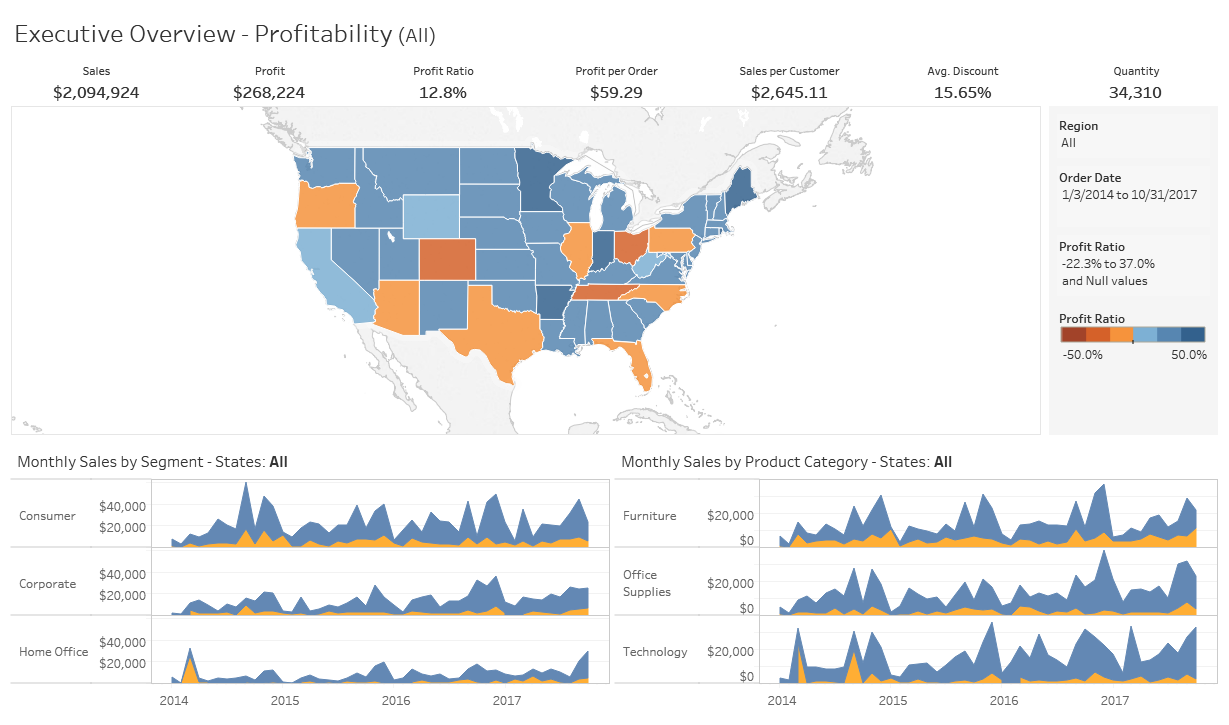
For some other clients, dashboards are as complex as 30 charts they look at weekly to track results of their multiple concurrent campaigns.


See how easy these dashboards turn KPIs into visual, understandable and actionable insights?
Are your teams using something this simple? And if not, WHY? There are multiple dashboard companies out there that you can implement at your company, including Tableau and Klipfolio.
Of course, you can also call us at Massa and we’ll use our tools to set them up just for you, with 24/7 access to custom reporting and digestible dashboards just for your company.
Food for Thought: Avocado Gazpacho

It’s summertime in Chicago, and while there is typically no more beautiful time in the city, it is just plain hot right now. Lately I’ve wanted nothing more than to sit directly in front of the air conditioning with refreshing foods and beverages at my disposal. I can’t even think about turning on my stove, let alone my oven. So along came avocado gazpacho.
Beyond being cold and delicious, there’s nothing simpler than throwing everything in a blender (or food processor) and eating. And just like Ina always says, I like to garnish whatever I’m serving with the ingredients in the food – in this case some diced avocado, tomato and cilantro. That makes it easy for guests to know what they’re getting at a glance, just as a dashboard does for your data.
Give this version a try. It’ll make your brains fall out.

Bonnie Massa
Bonnie Massa is Founder and President of Chicago-based Massa & Company, Inc. She works with companies and nonprofits to make the best use of their information about customers, partners, donors and sponsors. With more than 40 years of experience in marketing and predictive analytics, Bonnie is passionate about helping clients make informed, data-driven decisions to increase the value of their customer base. She strongly believes that making pasta and ice cream from scratch are worth the effort, and she spends much of her free time testing and re-testing that theory.